Slabs - Sliding & Overturning
Slab sliding and overturning checks are done automatically for all service load combinations in RISAFoundation. These checks are similar to the sliding and overturning checks for footing elements, but differ in that each load category is considered as stabilizing or destabilizing (instead of each component of each load category as currently used by footing elements). For additional advice on this topic, please see the RISA Tips & Tricks webpage at risa.com/post/support. Type in Search keywords: Mat Slab Overturning.
Demand vs Resisting Forces
Forces (overturning or sliding) are considered based on load category, not on the overall load combination loads. For more information, see the Footing Stability and Overturning sections in Footings Results. Footing Results specifically talk about footings, but the same considerations hold for slabs as well.
Let's show an example. Below, we have a slab that supports a four leg tower. The tower has both dead loads and wind loads applied. If we view a load combination with both dead load and wind load, it may look something like this:
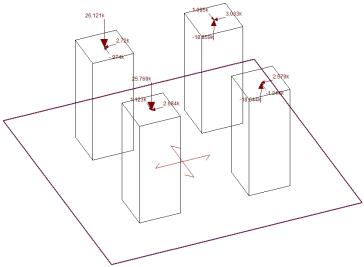
Next, if we look at the model by load category, we'll see something like this:

Click on image to enlarge it |
|
|
DL Category |
|

Click on image to enlarge it |
|
| WL Category |
When coming up with overturning and sliding demand/resistance, the contribution of EACH category is taken separately. This is even more important when you have more load categories. Here, if attempting to verify the program, you would take all of the loads in the DL category and sum their effects for both overturning and sliding. From this, you can see whether there is a net overturning/sliding force or a resistance force. This would then determine whether this value ends up in the demand or resistance column. You would do the same process for all load categories in a given load combination. Once you've done that, you sum up each column (demand vs resistance) and these are the values you'll find in the program.
Overturning
The slab overturning checks are presented in the Slab StabilitySpreadsheet, shown below.

Click on image to enlarge it
This spreadsheet lists the overturning checks for each slab under each service load combination.
Angle
This is the Local Axis Angle from the Slabs Spreadsheet. This just gives the local axis of the slab, which defines the orientation of the sliding and overturning checks.
Overturning Moments
The Mo-xx and Mo-zz columns represent the overturning moments about the slab x and z local axes, respectively. The program will consider overturning about all edges of the slab (see image below); the worst case in each direction is reported in the spreadsheet.
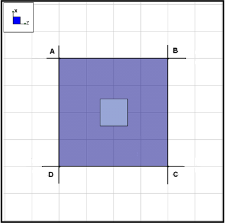
RISAFoundation calculates the moment about each of the four orthogonal lines set at the extreme points of the slab (AB, BC, CD, AD). Mo-xx reported in the spreadsheet is the largest moment taken about either AD or BC. Mo-zz reported in the spreadsheet is the largest moment taken about either AB or CD.
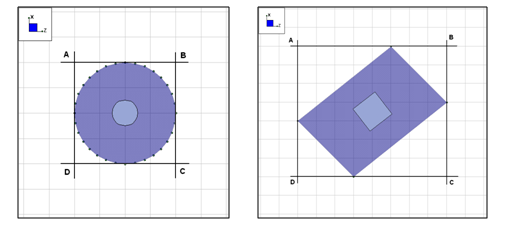
For more complex slabs, RISAFoundation sets four orthogonal lines at the four extreme points of the slab along the xx- and zz-axes. The program then calculates the moment about each of the four lines (AB, BC, CD, AD). Mo-xx reported in the spreadsheet is the largest moment taken about either AD or BC. Mo-zz reported in the spreadsheet is the largest moment taken about either AB or CD. These moments are calculated about the bottom face of the slab.
- For slabs in RISAFoundation, the loading is applied to the mid-height of the slab for finite element calculations. However, for slab overturning checks the program will assume the loading is applied at the top of the slab. This affects the overturning when column/wall shear loads are applied to the slab.
- If the Local Axis Angle is non-zero, the images above would be skewed at that angle.
Resisting Moments
The Ms-xx and Ms-zz columns represent the resisting moments about the slab local x- and z-axes, respectively. The program will consider all point loads, line loads and area loads in addition to the self weight in the calculation of the moments. The soil overburden pressure in the Slabs Spreadsheet is also considered to resist overturning. These moments are calculated about the bottom face of the slab.
Ratio
The Ms-xx/(Mo-xx) and Ms-zz/(Mo-zz) columns represent the ratio of resisting moment to overturning moment. This is then compared against the Overturning Safety Factor, SF, value set in the Load Combinations Spreadsheet. If this value is lower than the SF, then the value in the spreadsheet will be in red and your slab fails the overturning check.
Limitations
- Currently, the program does not consider whether an individual slab is connected to other elements in the model. The program simply calculates the overturning and resisting forces it is seeing on that slab to determine the safety factor. The slab may, however, be connected to grade beams, pile caps, footings or other slabs that would prevent overturning of the slab from actually occurring.
- The overturning is reported for each individual slab element. If a system of slabs is connected to one another, each overturning check will occur individually and the overturning of the overall group is not considered.
Sliding
The sliding check is done along both the slab local x- and z-axes and the results are presented in the Slab Stability Spreadsheet, shown below.

Click on image to enlarge it
This spreadsheet lists the sliding checks for each slab under each service load combination.
Angle
This is the Local Axis Angle from the Slabs Spreadsheet. This just gives the local axis of the slab, which defines the orientation of the sliding and overturning checks.
Applied Forces
The Va-xx and Va-zz columns represent the applied lateral force that causes sliding along the slab local x- and z-axes, respectively.
Resisting Forces
The Vr-xx and Vr-zz columns represent the resisting lateral forces that counteract sliding along the x- and z-axes, respectively. These loads include applied normal loads and self weight, and are multiplied by the Coefficient of Friction set in the Solution tab of Model Settings. The passive pressure is also considered as a sliding resisting force in both the slab's local z and x directions.
Sliding Ratio (SR)
The SR-xx and SR-zz columns represent the ratio of resisting forces to applied forces. If this value is lower than 1.0, then your slab is subject to sliding.
Limitations
- Currently, the program does not consider whether an individual slab is connected to other elements in the model. The program simply calculates the sliding and resisting forces it is seeing on that slab to determine the safety factor. The slab may, however, be connected to grade beams, pile caps, footings or other slabs that would prevent sliding of the slab from actually occurring.
- The sliding is reported for each individual slab element. If a system of slabs is connected to one another, each sliding check will occur individually and the sliding of the overall group is not considered.
Overturning by Category
The Overturning by Category tab of the Slab Stability Spreadsheet shows a breakdown of the overturning and resisting categories for each slab and load combination. Each category's x and z components are considered to act as either an overturning or resisting value. This category tab shows how RISA comes up with the net category value for each load combination.
RISAFoundation takes the net sum of the overturning and resisting values for each category per the True Safety Factor Method. Each category will either net a resisting or an overturning value in the slab's local xx and zz directions. The net overturning or resisting value for each category is combined with all load categories in a given load combination to come up with the Safety Factor result in each direction. It is important to assign the categories properly for your model to get correct safety factor results in the program.

Click on image to enlarge it
Sliding by Category
The Sliding by Category tab of the Slab Stability Spreadsheet shows a breakdown of the sliding and resisting categories for each slab and load combination. Each category's x and z components are considered to act as either a sliding or resisting value. This category tab shows how RISA comes up with the net category value for each load combination.
RISAFoundation takes the net sum of the sliding and resisting values for each category per the True Safety Factor Method. Each category will either net a resisting or an sliding value in the slab's local xx and zz directions. The net sliding or resiting values for each category is combined with all load categories in a given load combination to come up with the Safety Factor result. It is important to assign the categories properly for your model to get correct safety factor results in the program.

Click on image to enlarge it